Mobile Soil Sampling on iPhone & iPad
GoGIS connects the stages of a soil sampling program on your phone or tablet. Start with field boundaries, generate numbered sample locations, and organize the points into a route. Record observations against each location, identify the sample bags, and bring the lab results back into the same project.
The workflow supports repeated collection as well as a single visit. Track which points are current or due for collection, and use related forms when you need to retain separate records for successive visits. GoGIS is available on Android and Apple devices; the examples below show the iPhone and iPad workflow.
One Project, from Field Boundaries to Results
The grid establishes where to sample. The route organizes the collection work. Forms preserve the observations, and sample IDs connect the returned results to their locations. Each stage uses the records from the preceding one.
1. Set Up Your Field Boundary
Load your field boundaries from a shapefile, GeoPackage, or KML file — whatever your farm management software or agronomist provides. The polygons become the containers for your sample grid.
2. Generate the Sample Grid
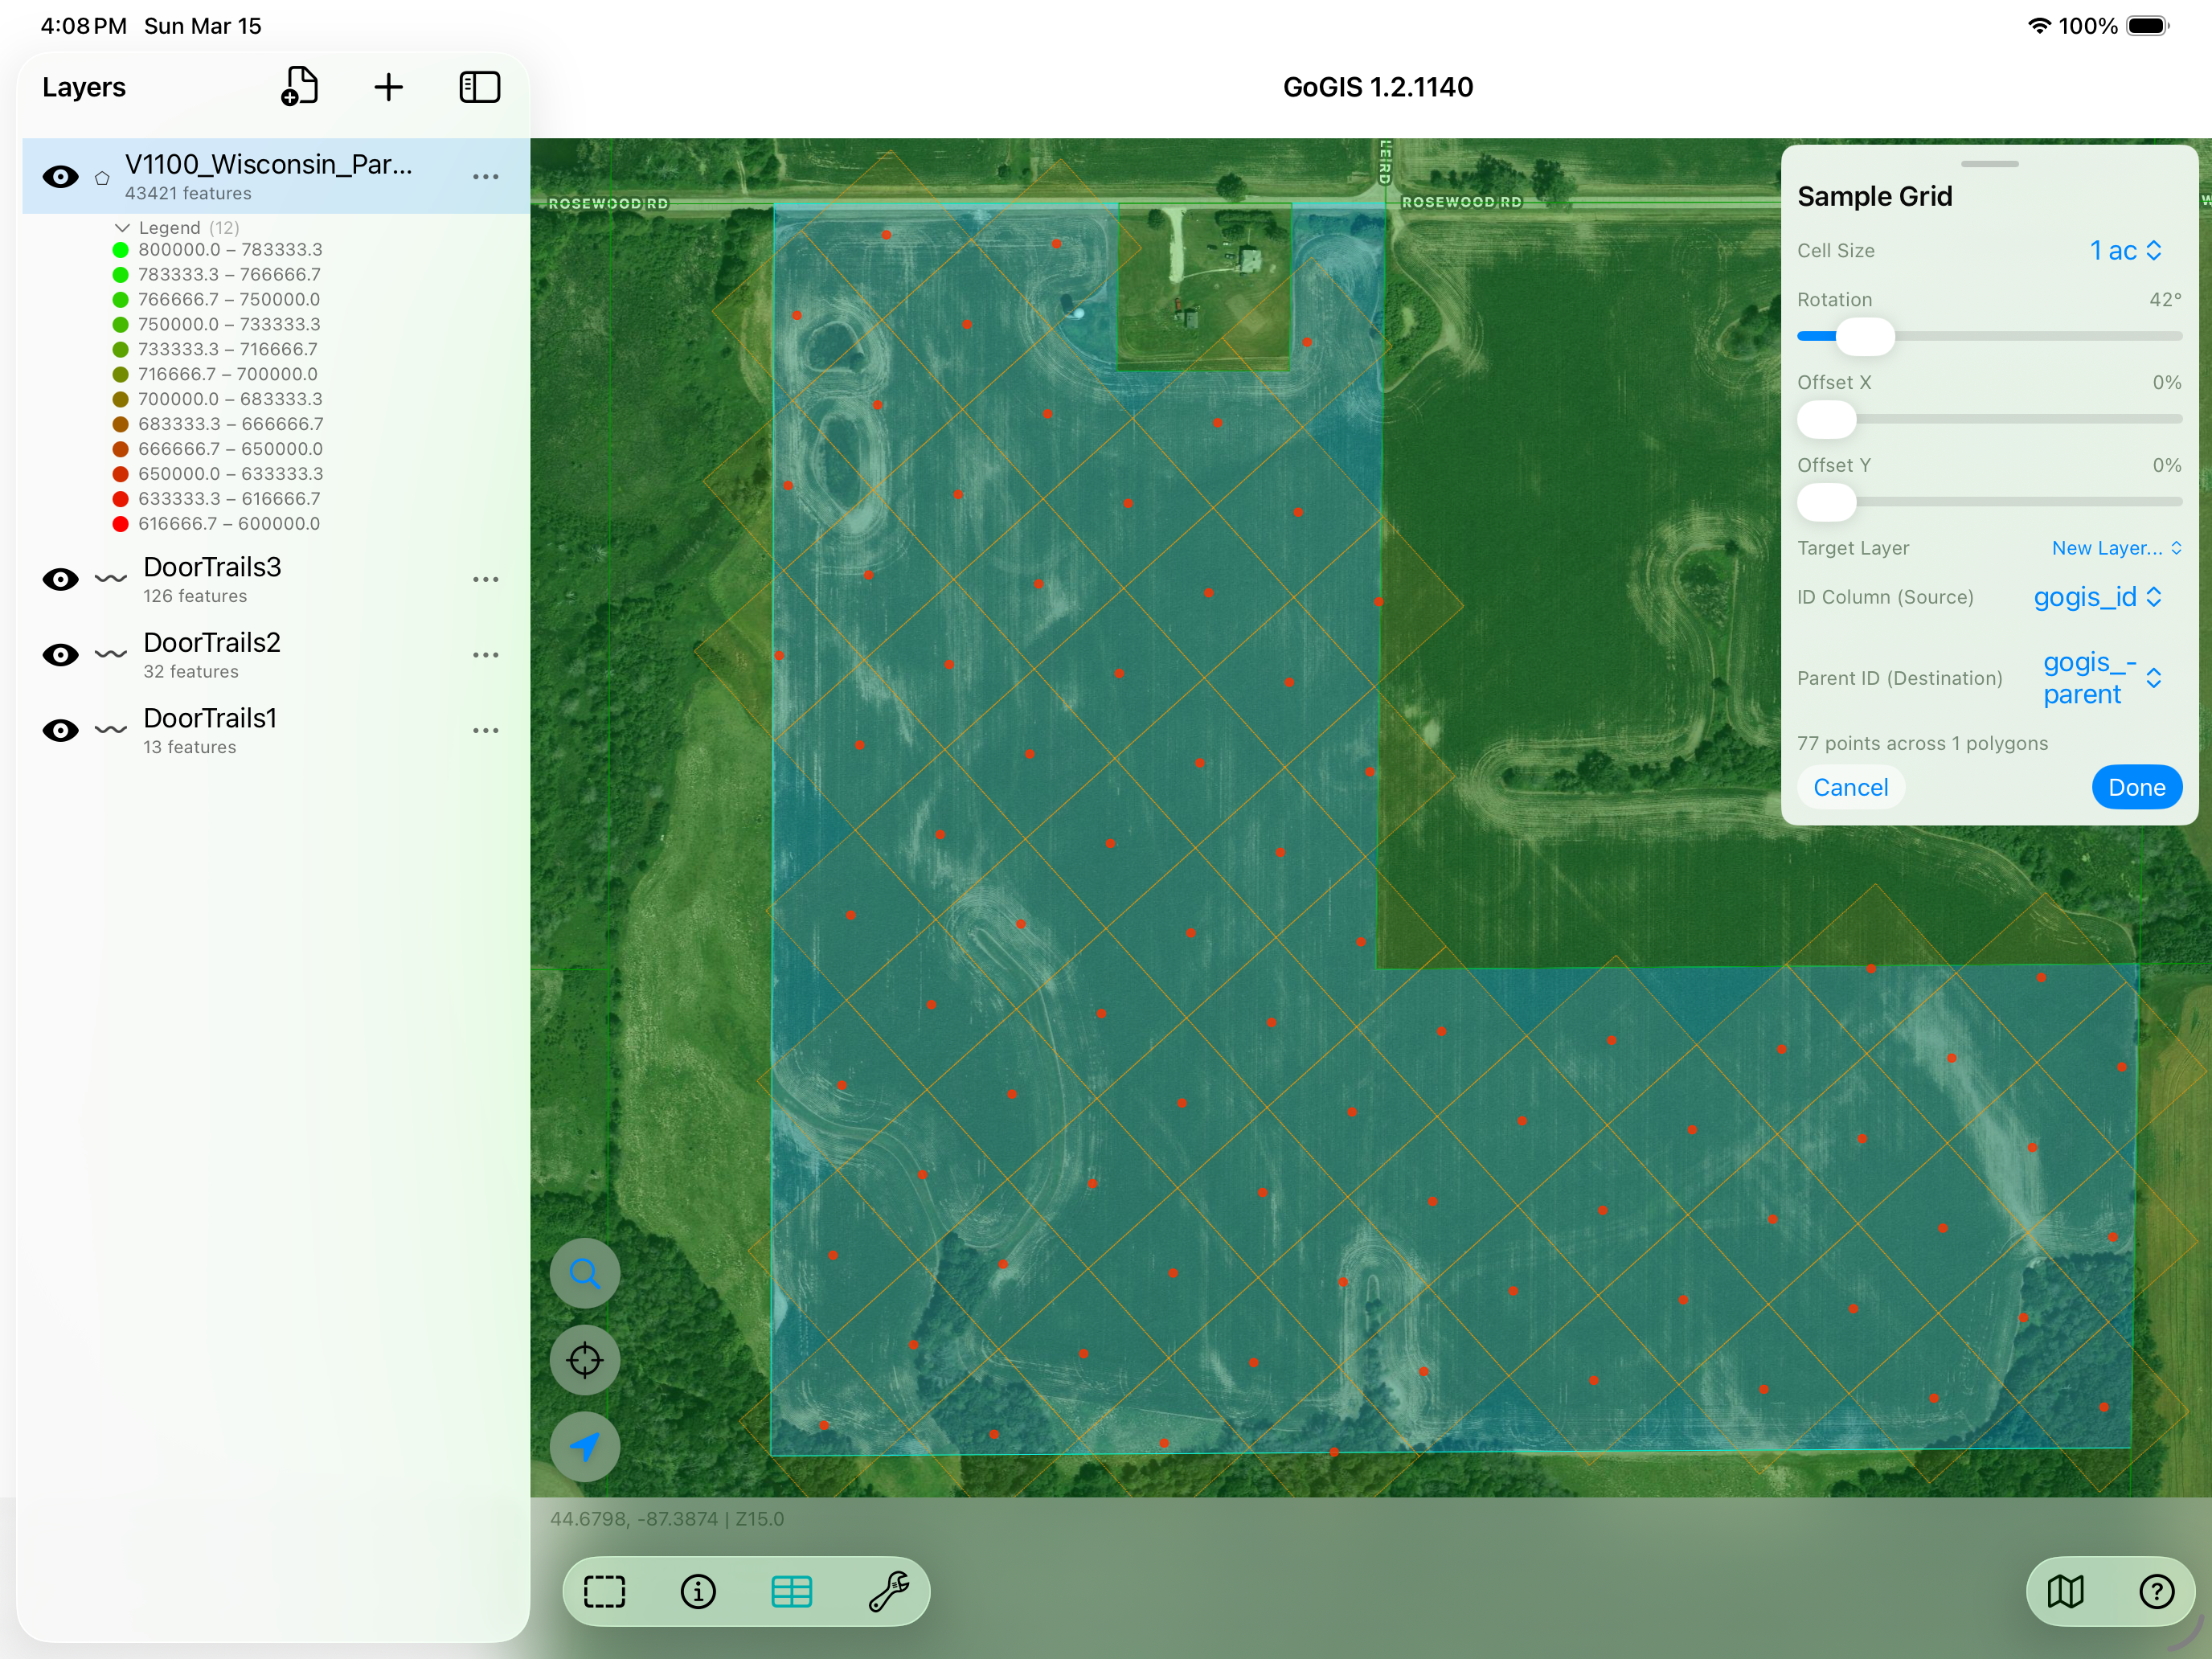
Select your field polygon and tap the sampling tool. GoGIS generates a numbered grid of sample points inside the boundary. You control the cell size in acres or hectares, and you can adjust the grid rotation and offset to align with rows or avoid obstacles. Each point gets a sequential ID automatically.
3. Print QR Bag Labels
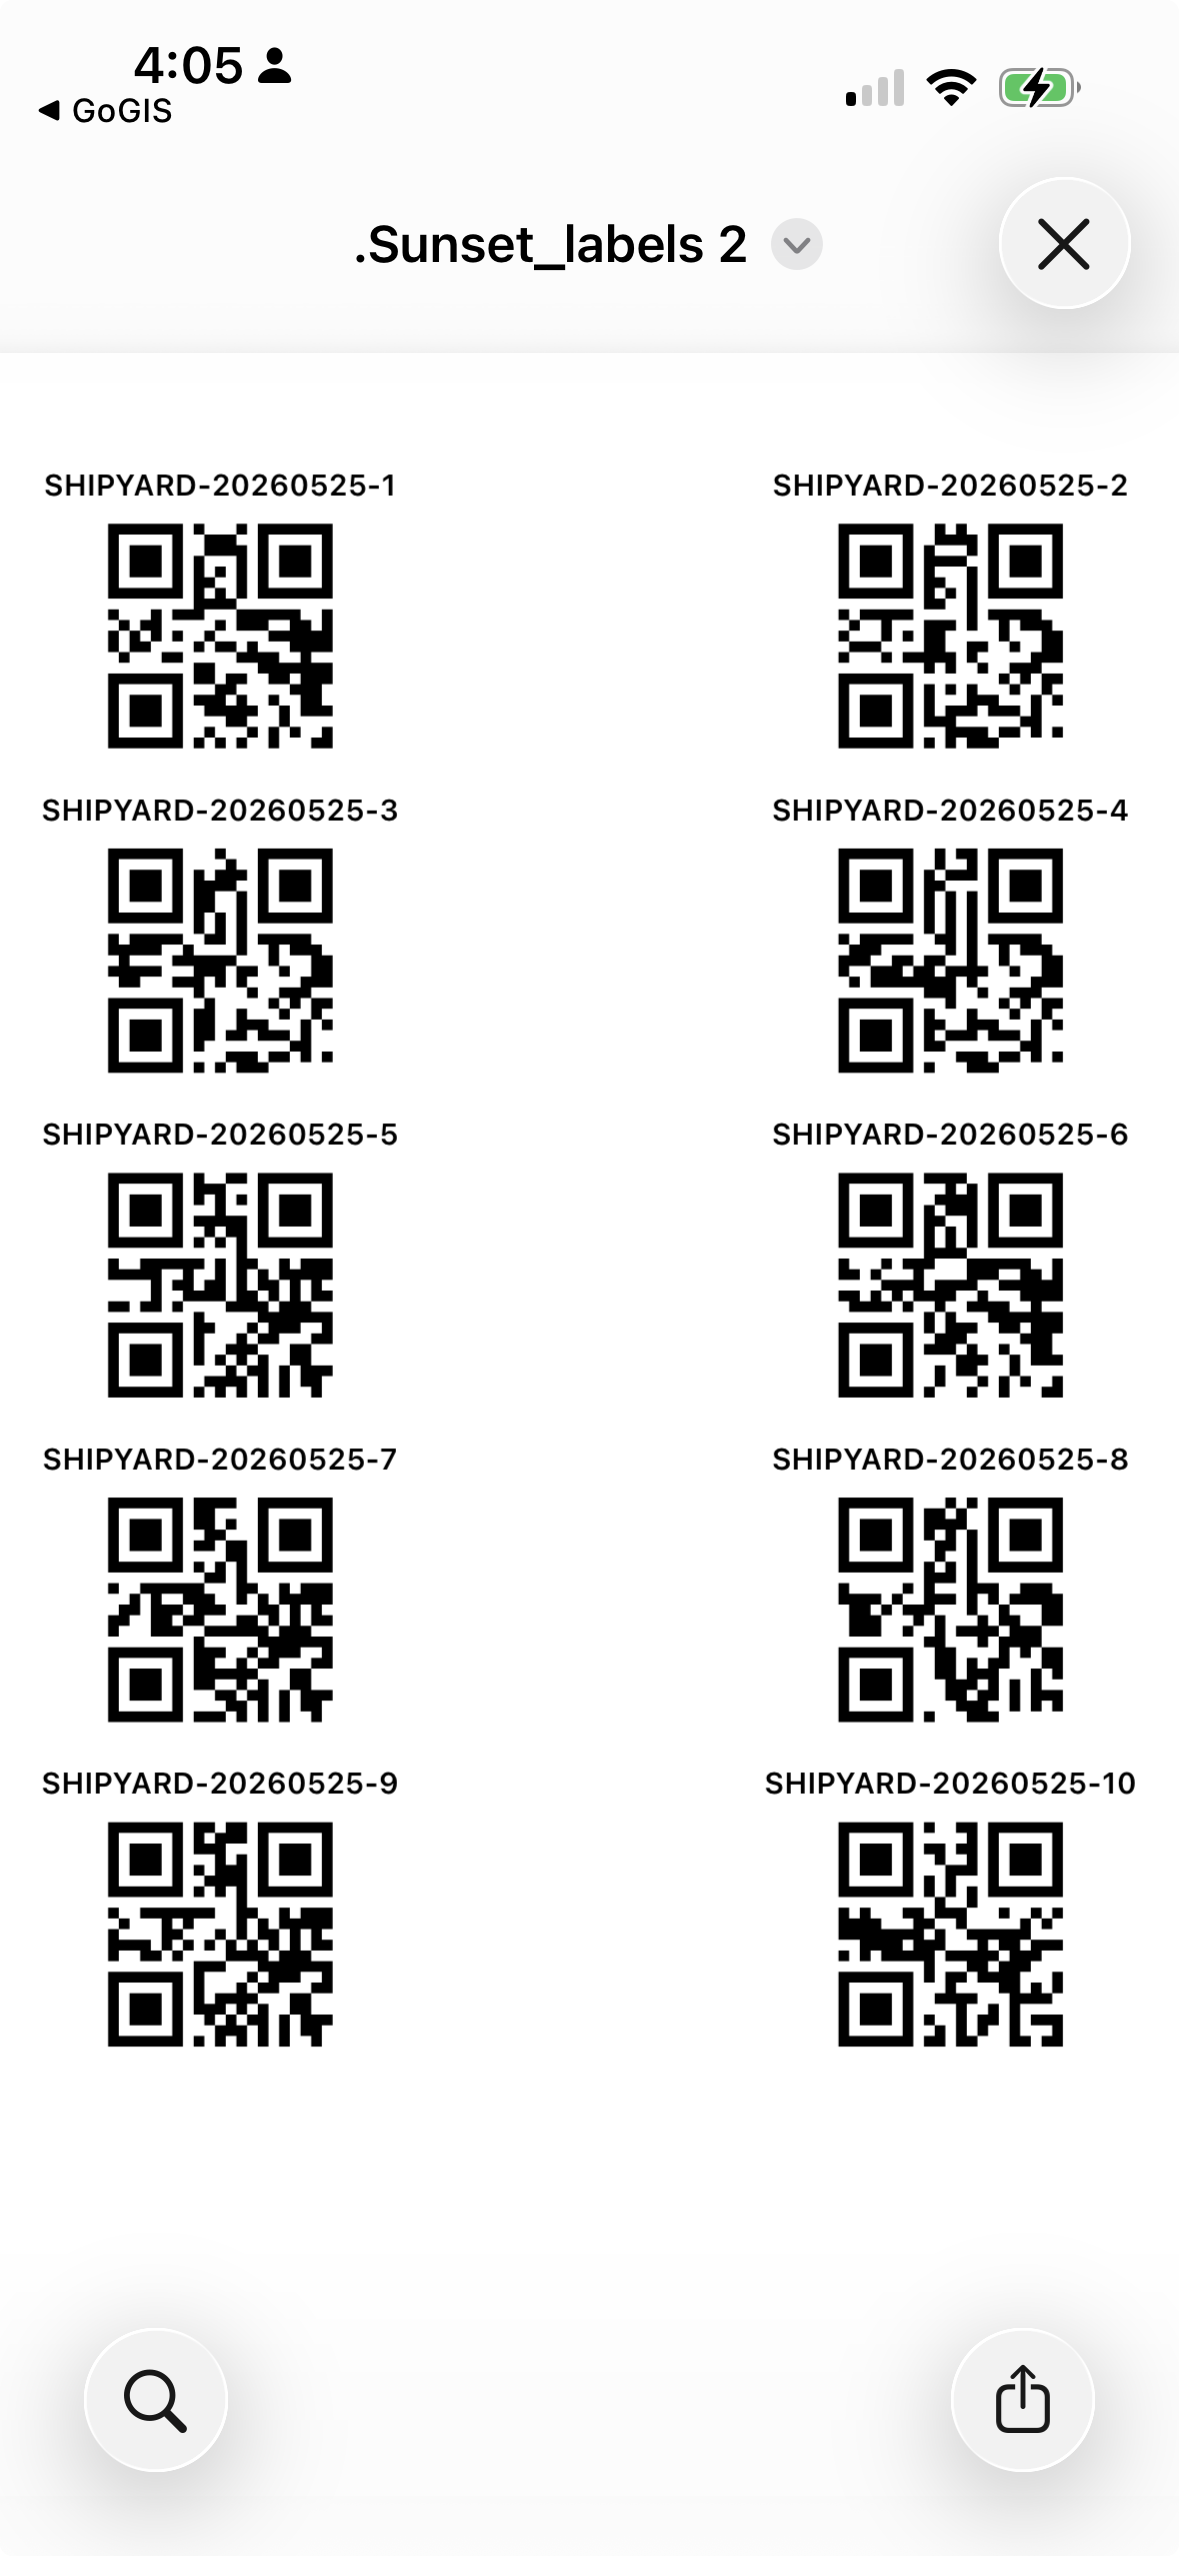
Before you head out, print peel-and-stick labels for your sample bags right from the app. GoGIS lays out a sheet of QR codes (or Code 128 barcodes) on A4 or US Letter — and you choose what goes on each label: a field name pulled from the boundary, the date, and the sample number or your own Bag ID. Stick one on each bag, then scan it back when you collect so every bag stays tied to the exact point it came from.
4. Walk to Each Point — by Proximity or by Route
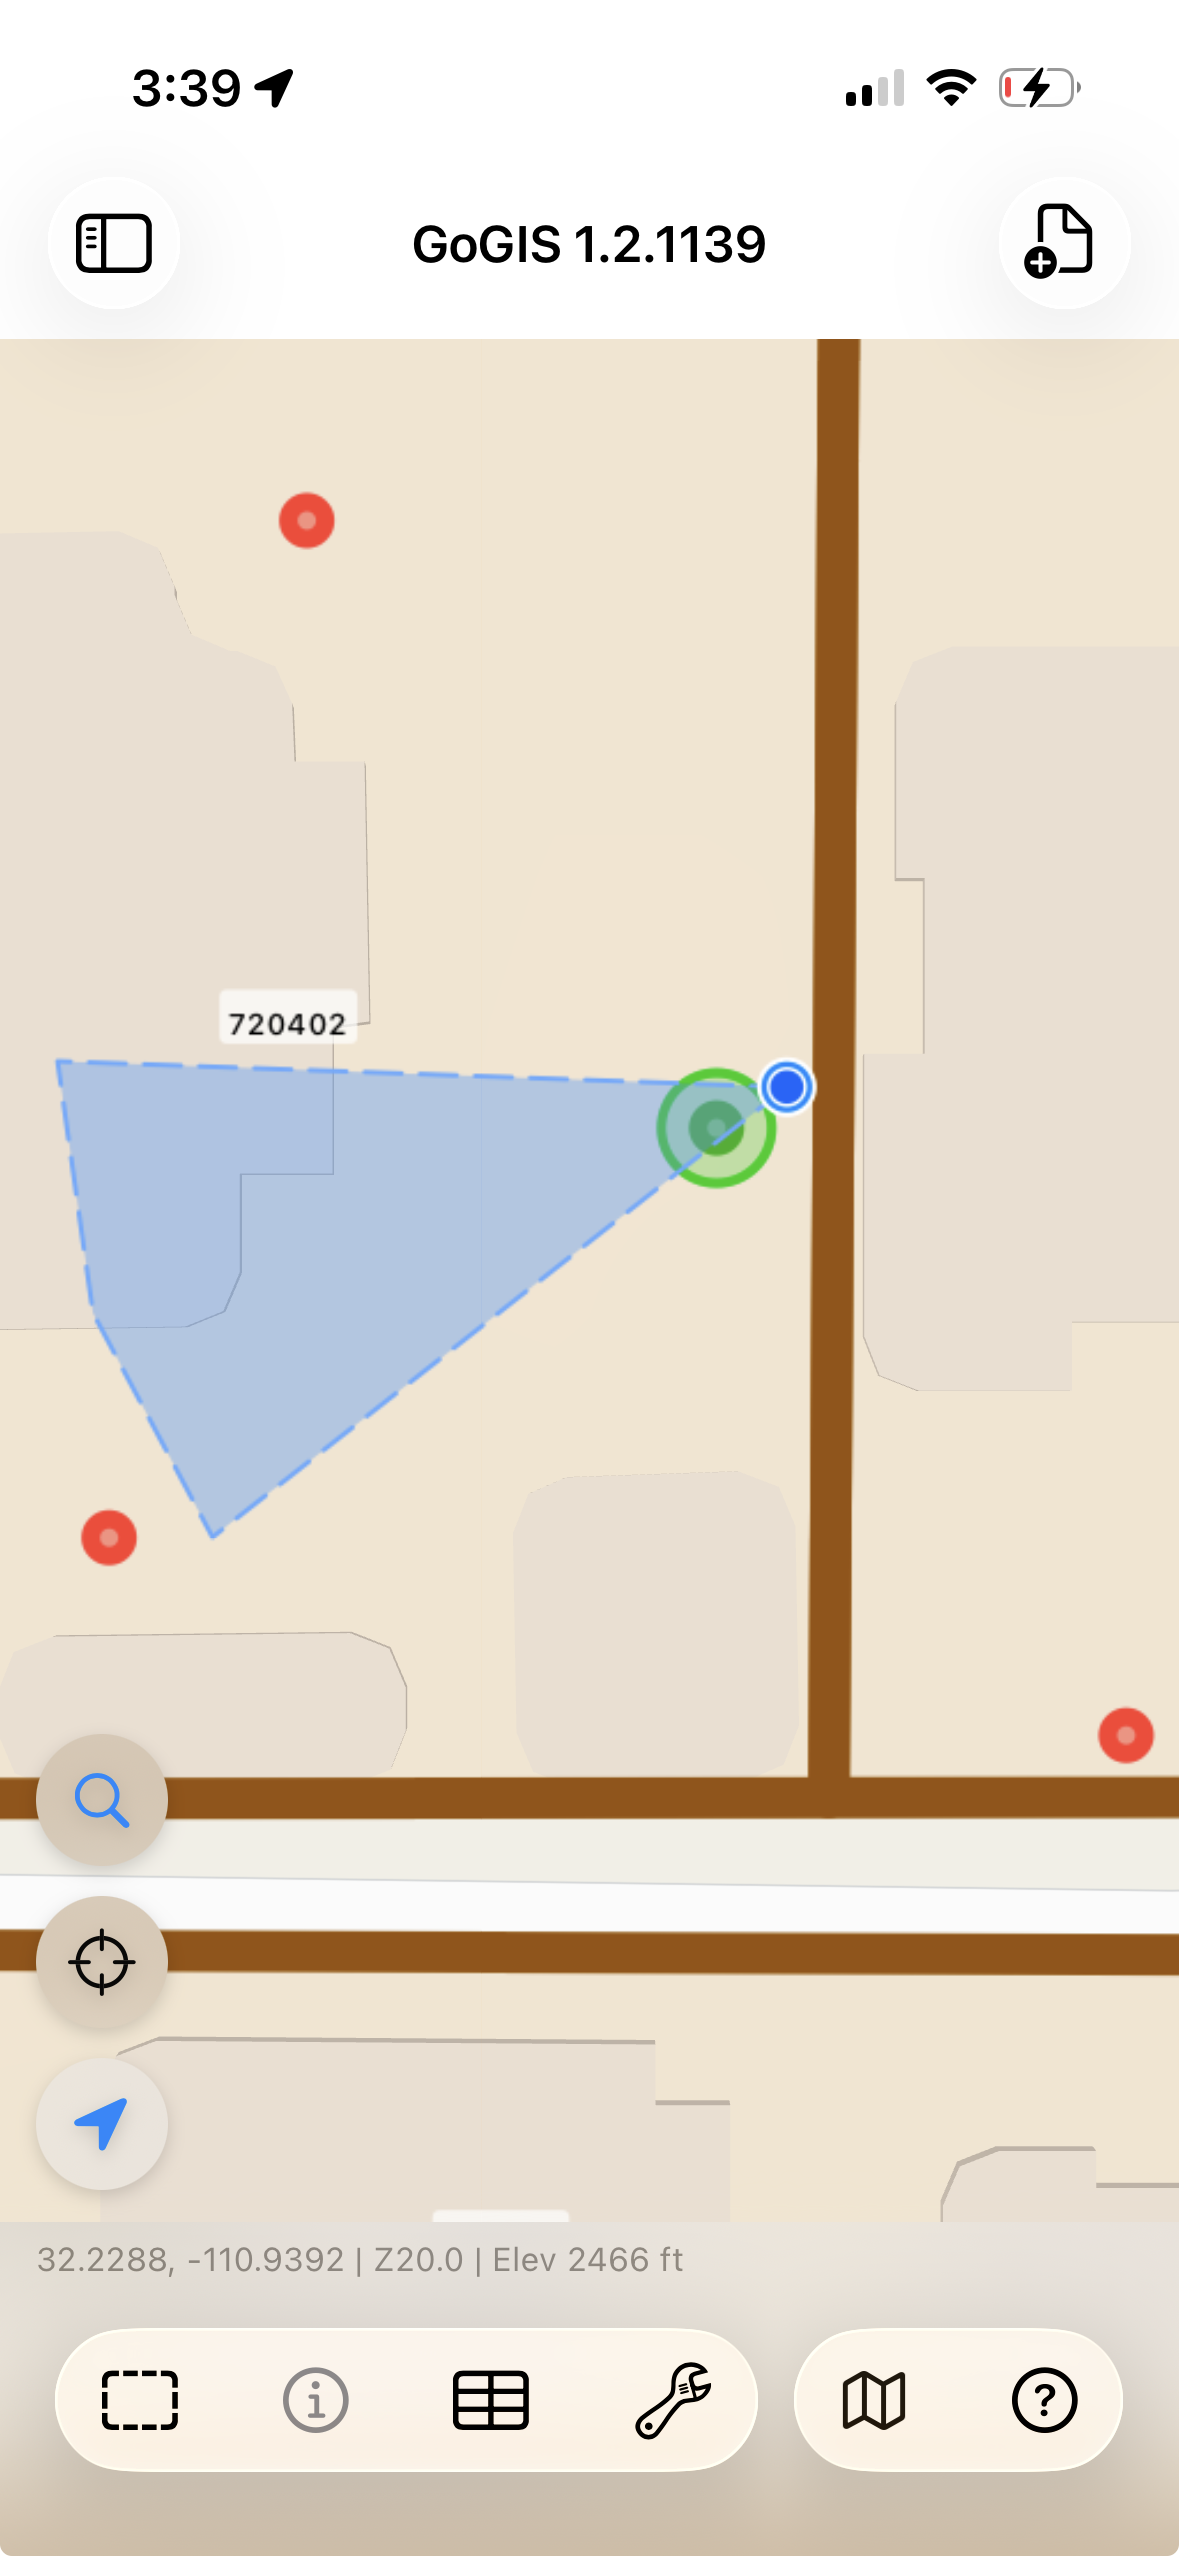
With the grid generated, head into the field. GoGIS shows your live GPS position on the map with a proximity circle around the nearest sample point. Walk toward it — the display updates in real time. When you're close enough, the nearest point highlights green so you know you're in the right spot.
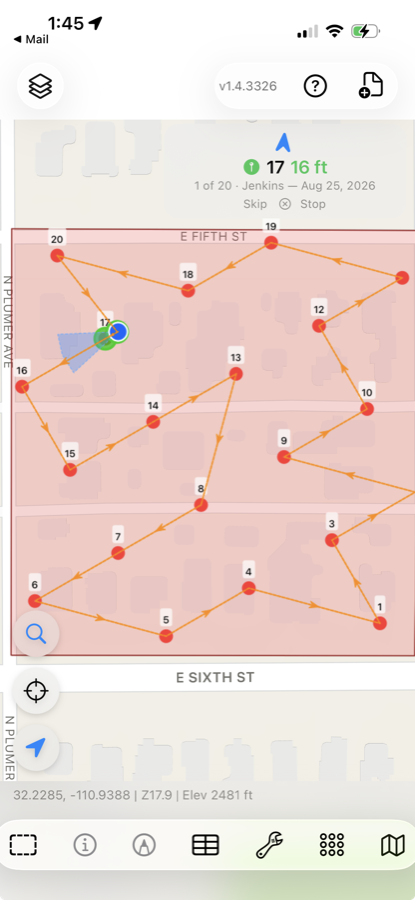
For a larger grid or several fields in one outing, use a route to organize collection. Tap Route and GoGIS lists the sample collections near you, with how many points each has left to visit. Pick one — or pick several, and they are walked as a single route.
The route covers only the points that still need collecting, ordered so the walk is short rather than in grid order. A compass arrow points to the next point, the banner counts down 3 of 14, and each save advances you to the next. Skip passes a point you cannot reach — a wet hole, a standing crop — and leaves it outstanding rather than marking it done.
One option is worth setting before you start: Bring me back here when done. Leave it off and the route ends at the last sample point, wherever that leaves you. Turn it on and GoGIS marks where you are standing — the gate, the truck — and plans the walk as a loop that returns there, which matters more than it sounds when the last point is half a mile from the road.
5. Collect Your Data
Tap the sample point to open the attribute form. Fill in your observations — soil color, texture, moisture, depth, whatever fields you've defined. Scan the barcode on your sample bag directly into a text field — look for the barcode icon next to any text field to activate the scanner. Snap a photo of the core or the site conditions. Hit save, and the point changes color to show it's been collected — see collection progress below for what the colors mean.
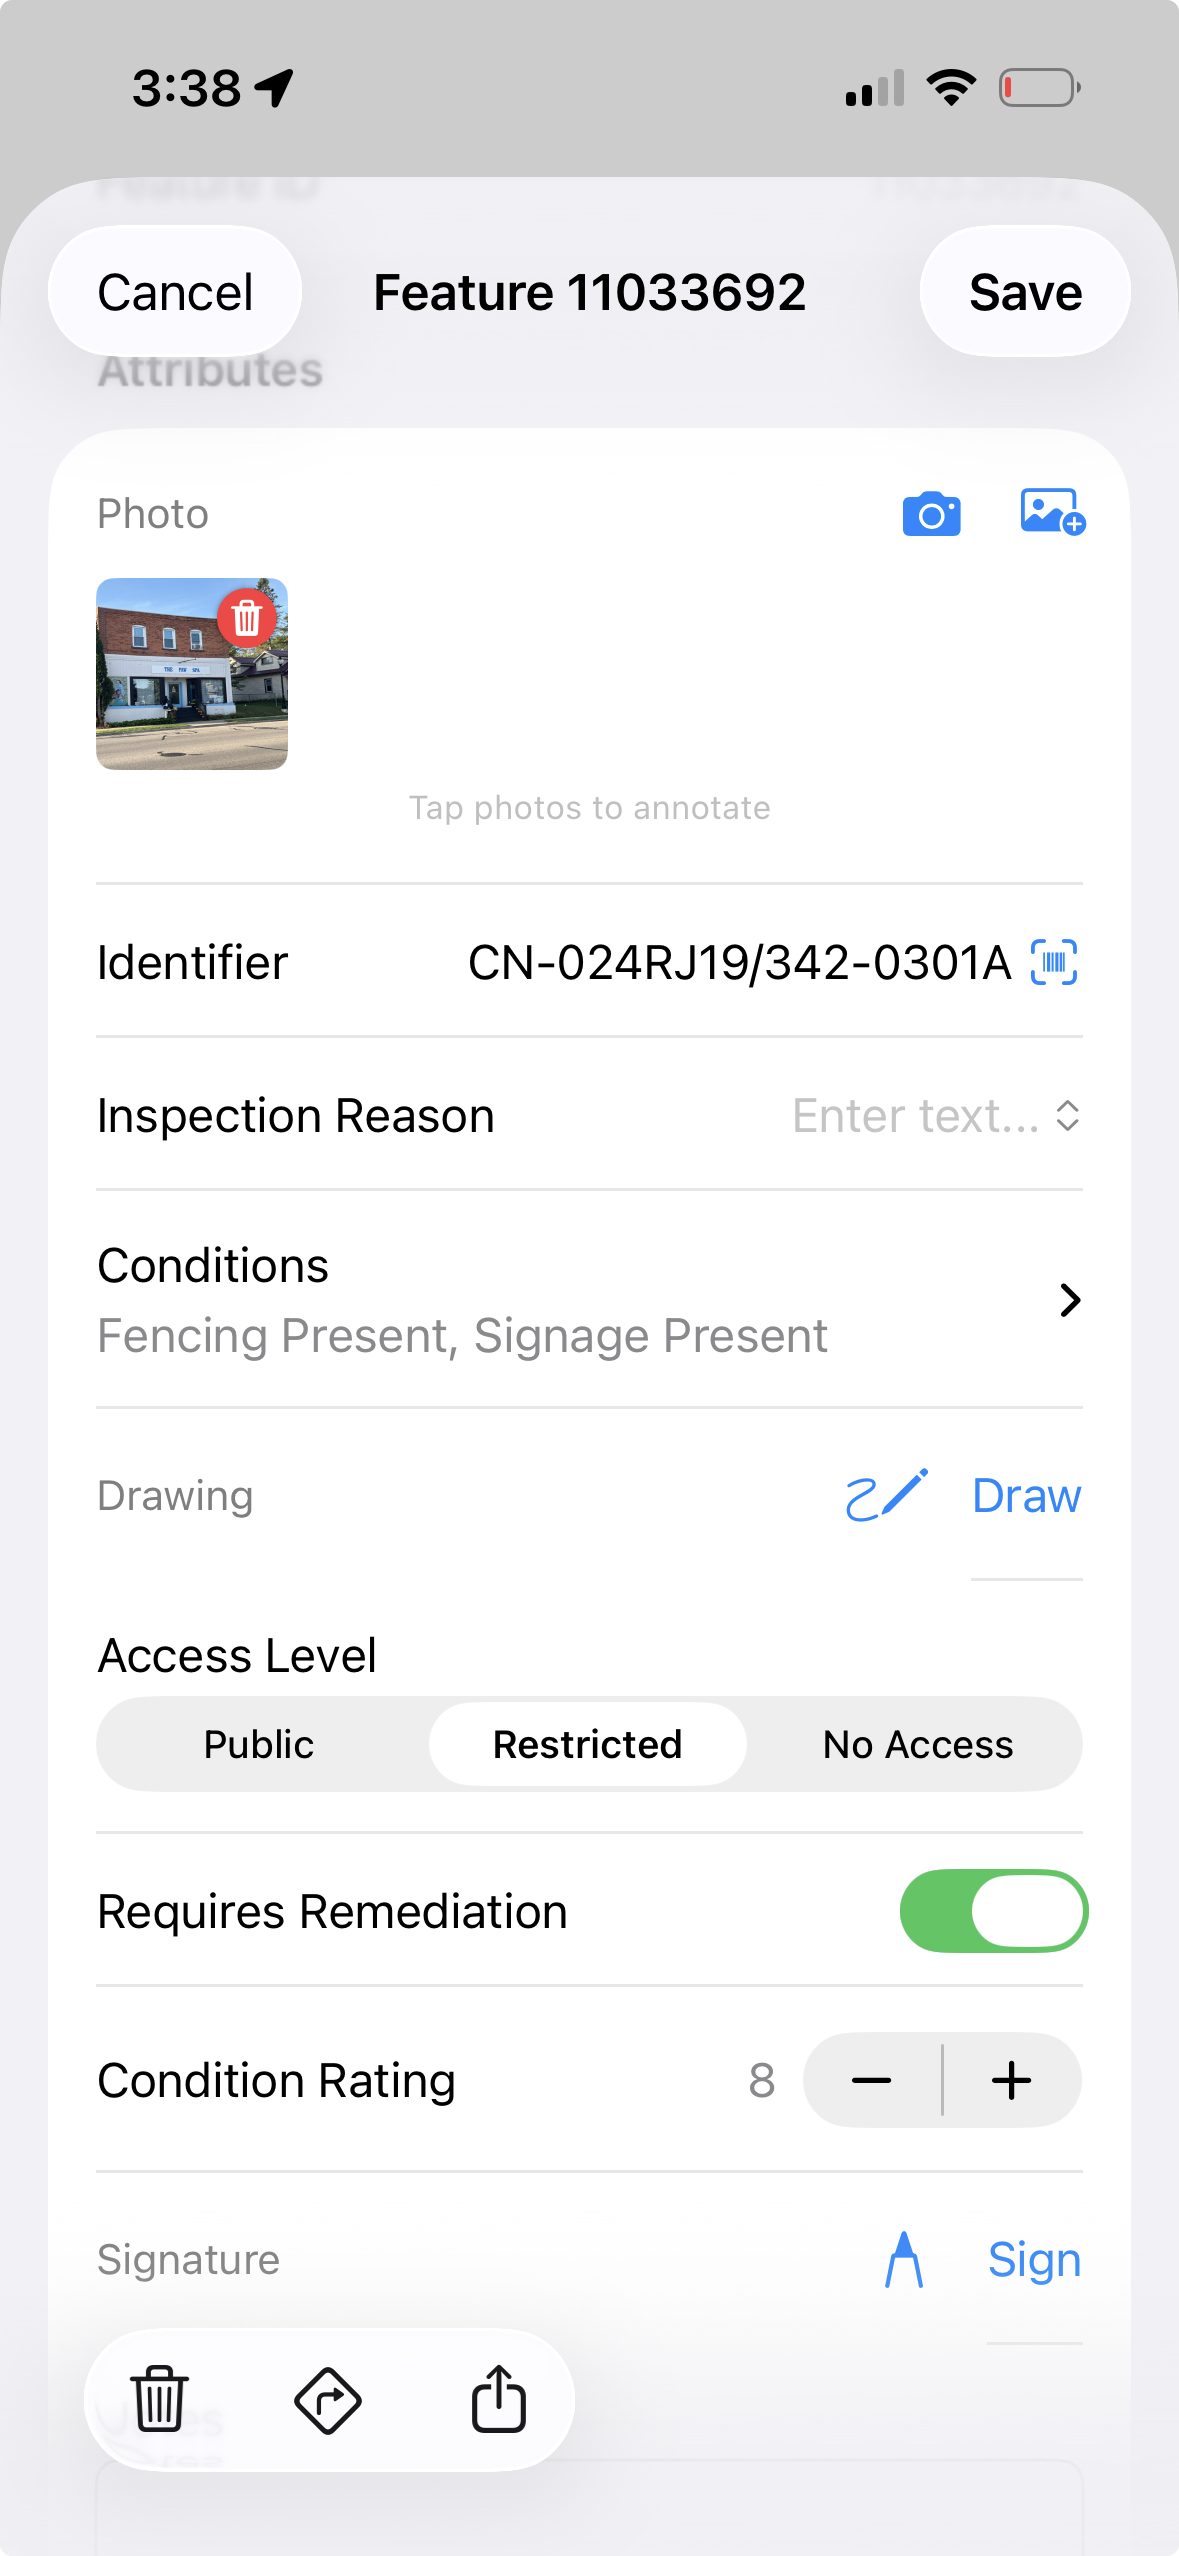
That form is the point's own base attributes — the columns on the layer itself. For a grid sampled once a season it is usually all you need, and it is the simplest thing to export: one row per point, every value in its own column. The trade is that a second visit overwrites the first. If the current condition of each point is all you need to keep, stop here and skip the next step.
6. Or Keep Every Visit with a Related Form
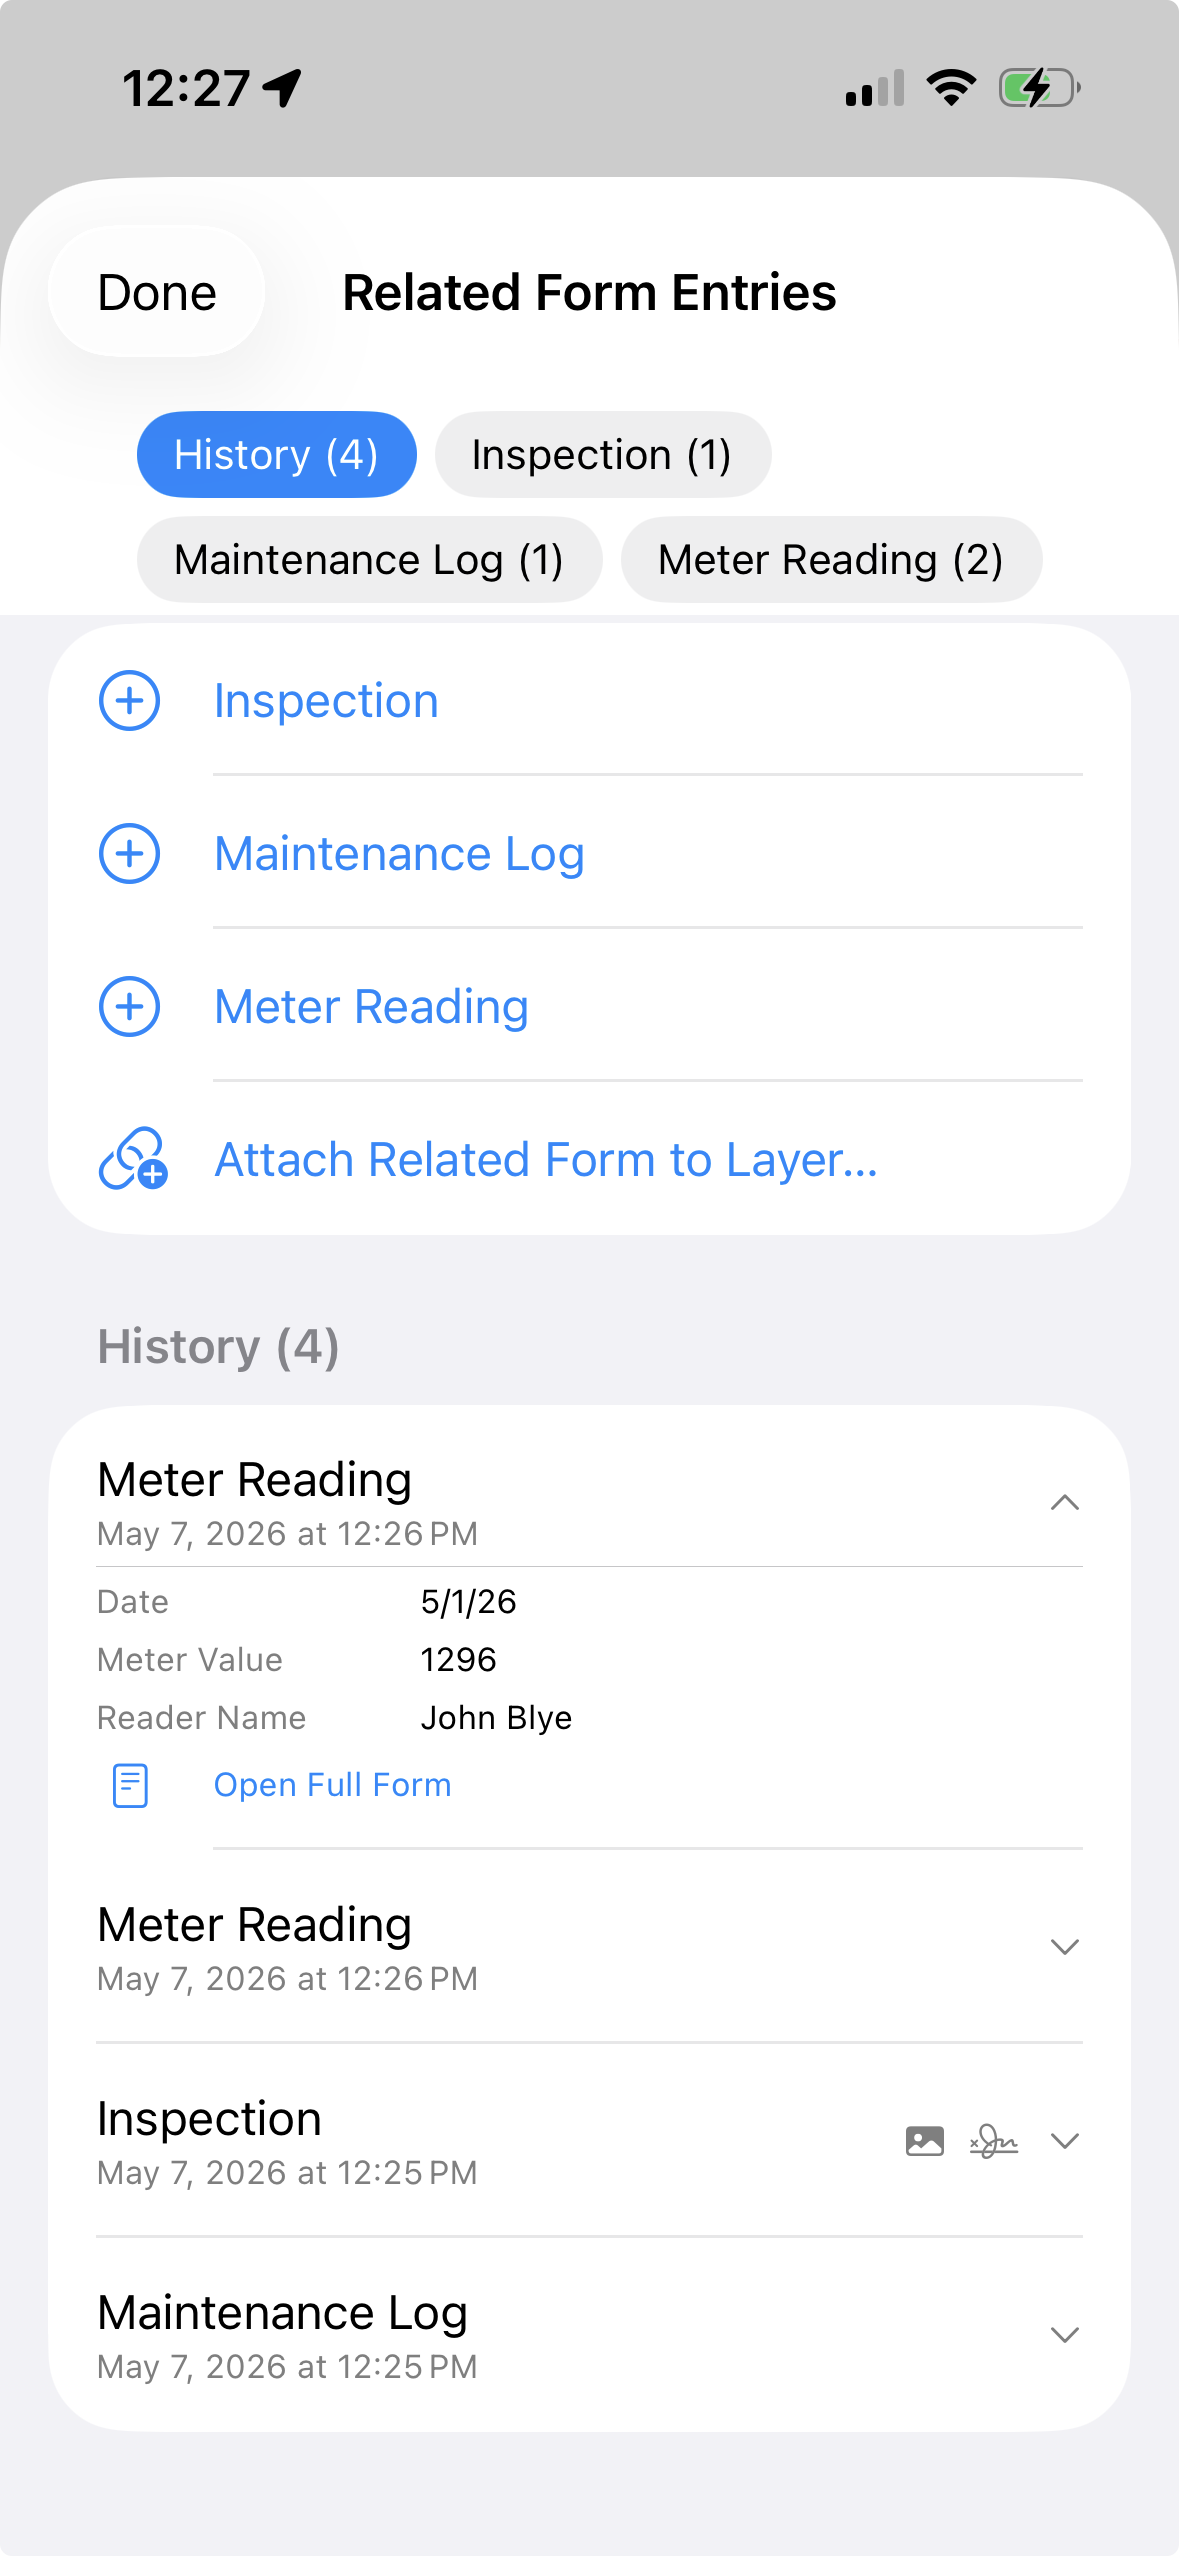
Sometimes one record per point isn't enough. A point might get re-tested, inspected, or re-cored on separate dates, and you want every visit kept — not overwritten. Attach a related form to your sampling layer and each collection adds a new dated entry linked to that point, with its own photos and fields. The sample's identity rides along with every entry, so an inspection from March and a re-test in October both stay tied to the same point and the same sample number.
7. Track Collection Progress Across Seasons
Sampling points use two clear statuses so you can see what remains to be collected:
- Red — To Do: the point still needs collecting.
- Green — Done: collection is complete.
Reuse your sampling locations across seasons and keep dated collection records linked to each point. The map shows collection progress, while related forms preserve the history of your visits.
8. Monitor the Whole Program — Layers and Fields
Across a dozen fields, you need more than colors on one map — you need the big picture. Open Tools › Sampling Status to see every sampling layer in one place. Each row shows how many points are done and how many remain to do, the completion percentage, the date of the last collection, and a thumbnail of the grid and its field boundary. Tap a layer and GoGIS turns it on and zooms straight to it on the map.
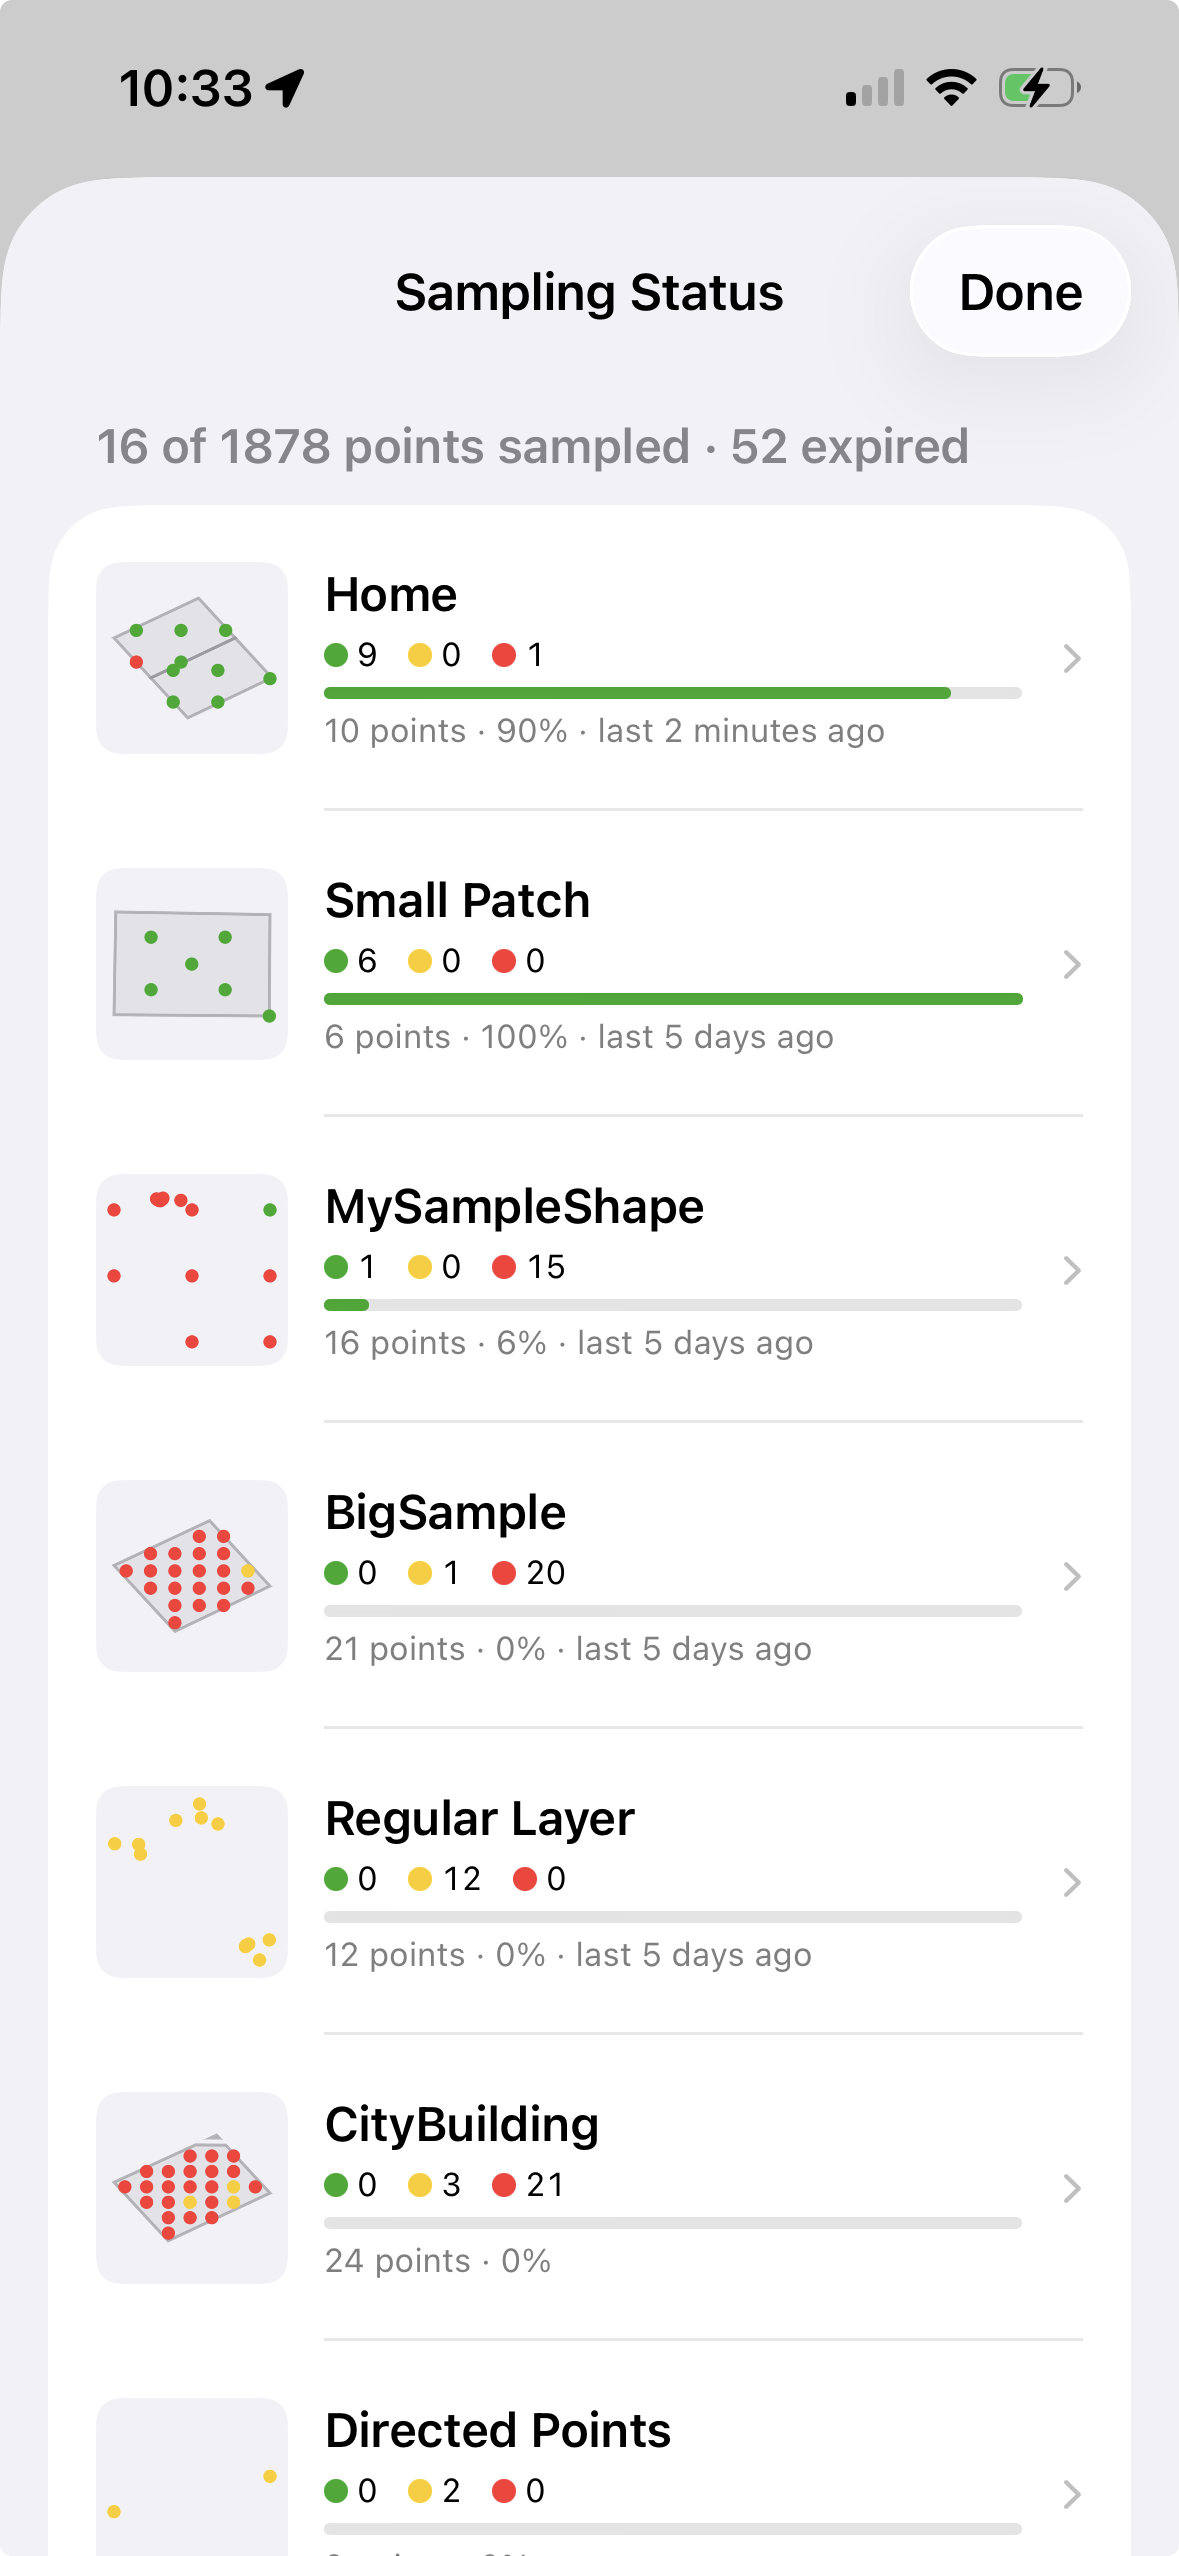
That is the Layers view — one row per sampling layer, the whole grid taken together. It answers “how is the program going?”
The Fields view answers a different question: “how is this parcel going?” It breaks a multi-polygon sampling layer into its individual fields, one row each, with percent complete per field. That is the view you want when a grower asks about the north eighty, or when you need a client PDF for one parcel without exporting the whole farm. A field that is sampled on two different layers appears once under each.
Both views share the same controls. Changed only narrows the list to layers with work that has not been exported yet — the short list of what you still owe someone. Select turns on multi-select so you can export a package covering exactly the layers, or exactly the fields, you choose.
9. Import Your Lab Results
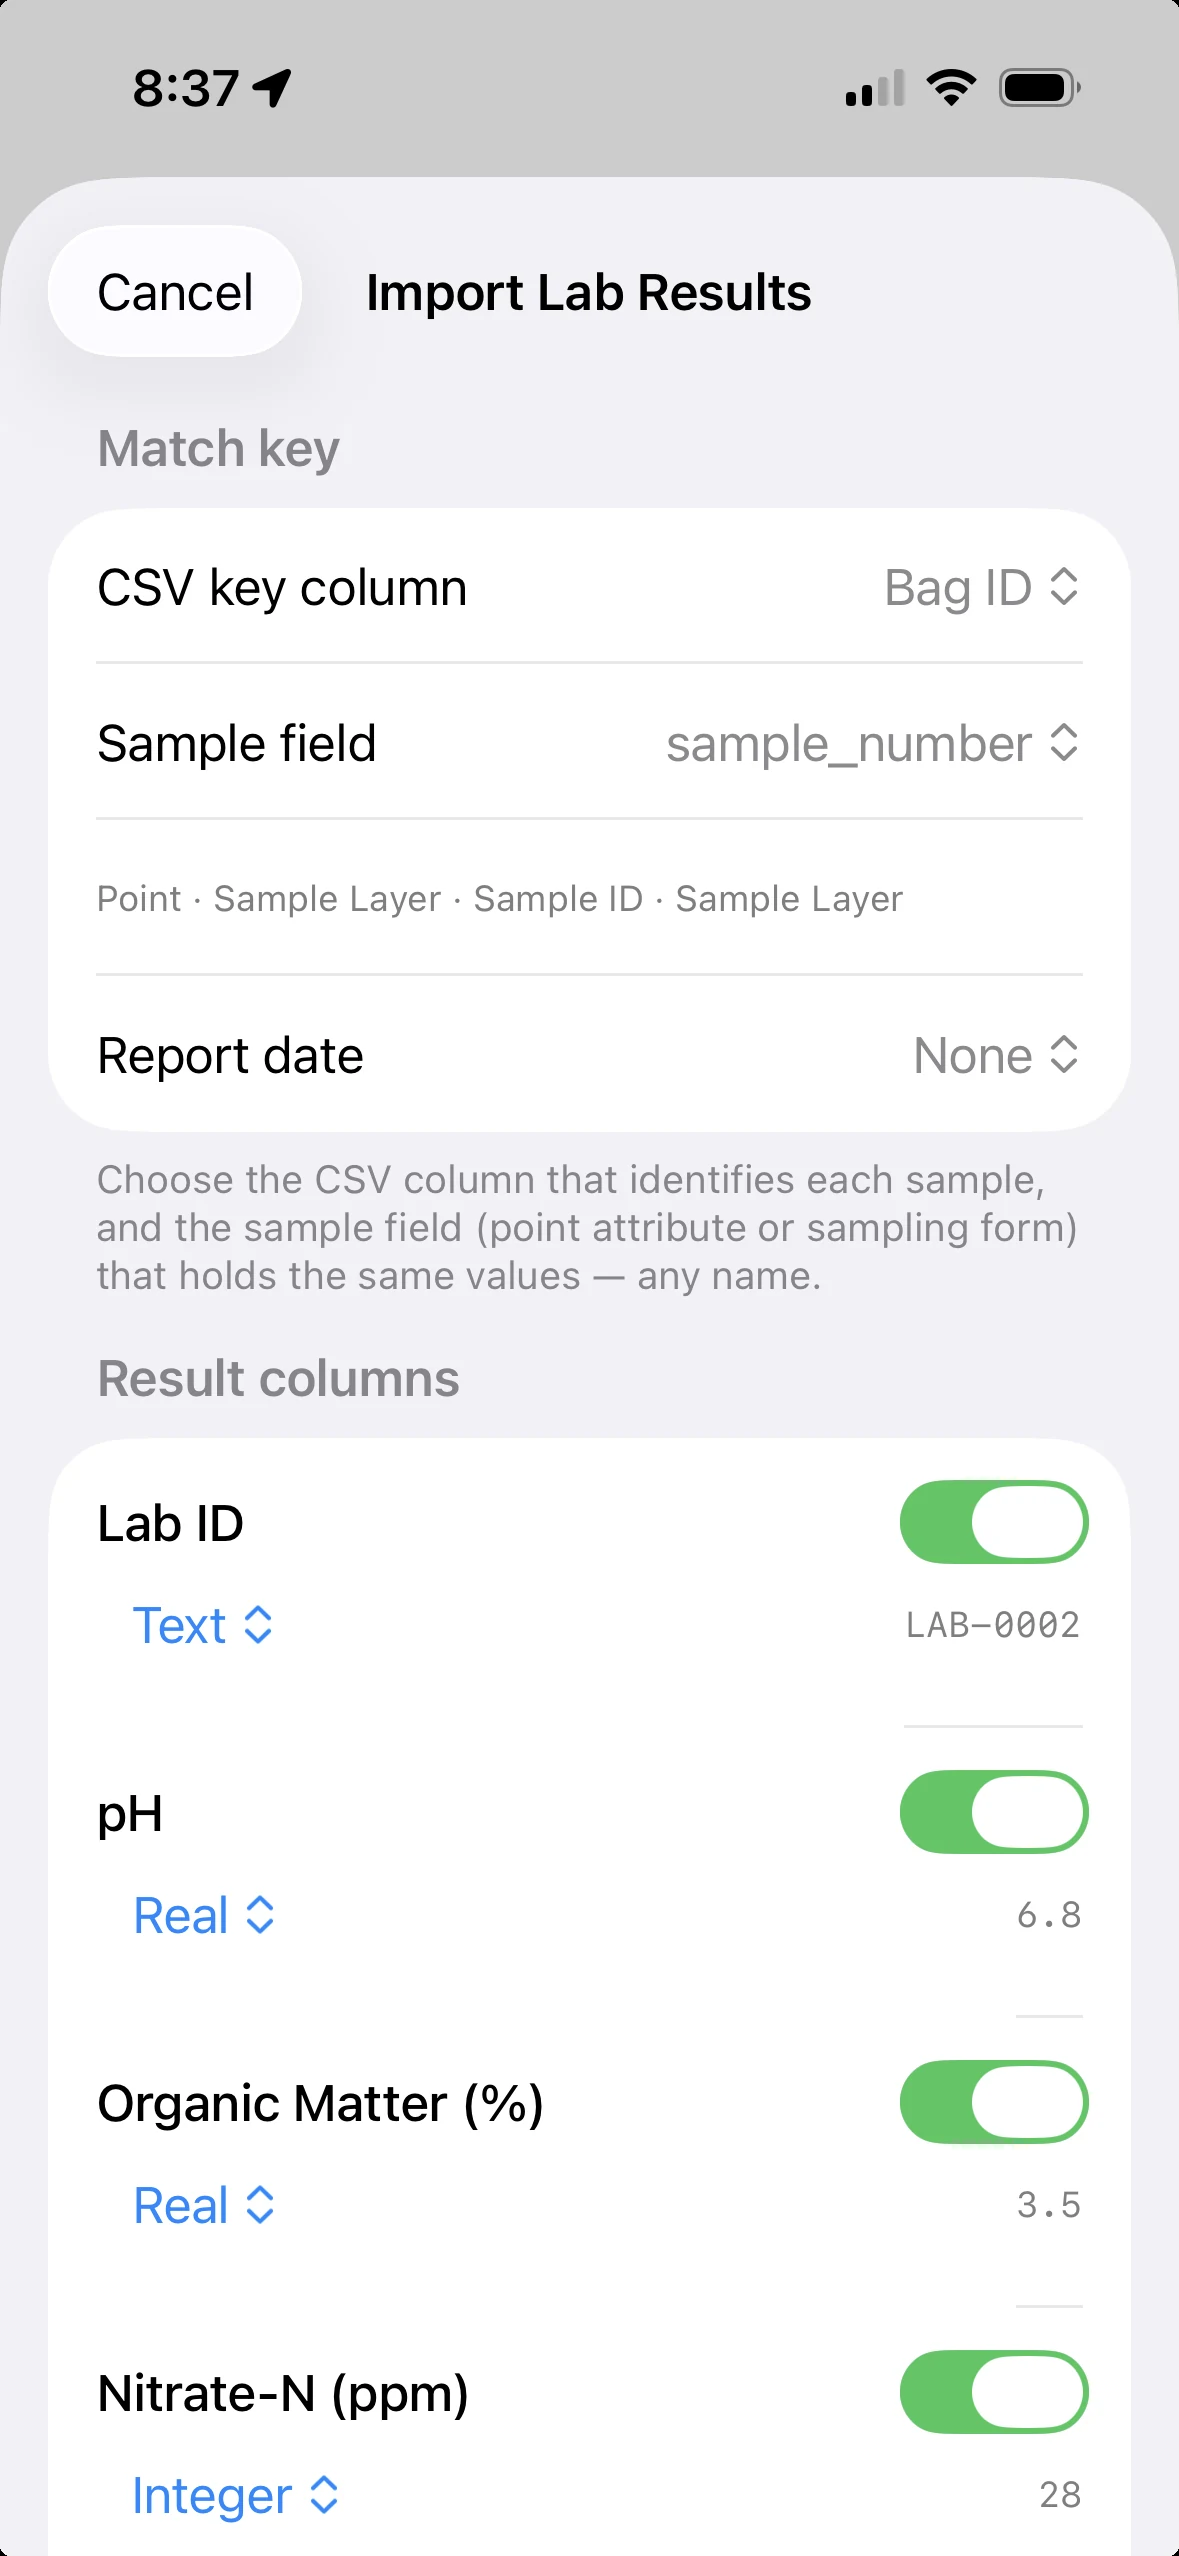
When the lab sends back your results, you don't re-type anything. Open Import Lab Results from the Sampling menu and pick the lab's CSV — or a ZIP of several. GoGIS matches each row to its sample point by Bag ID across every field, and files the values as a dated record on the point. Re-import next season and the new numbers stack up as history. The summary tells you exactly what matched, what didn't, and any duplicate IDs to fix.
10. Map Results as Heat Maps
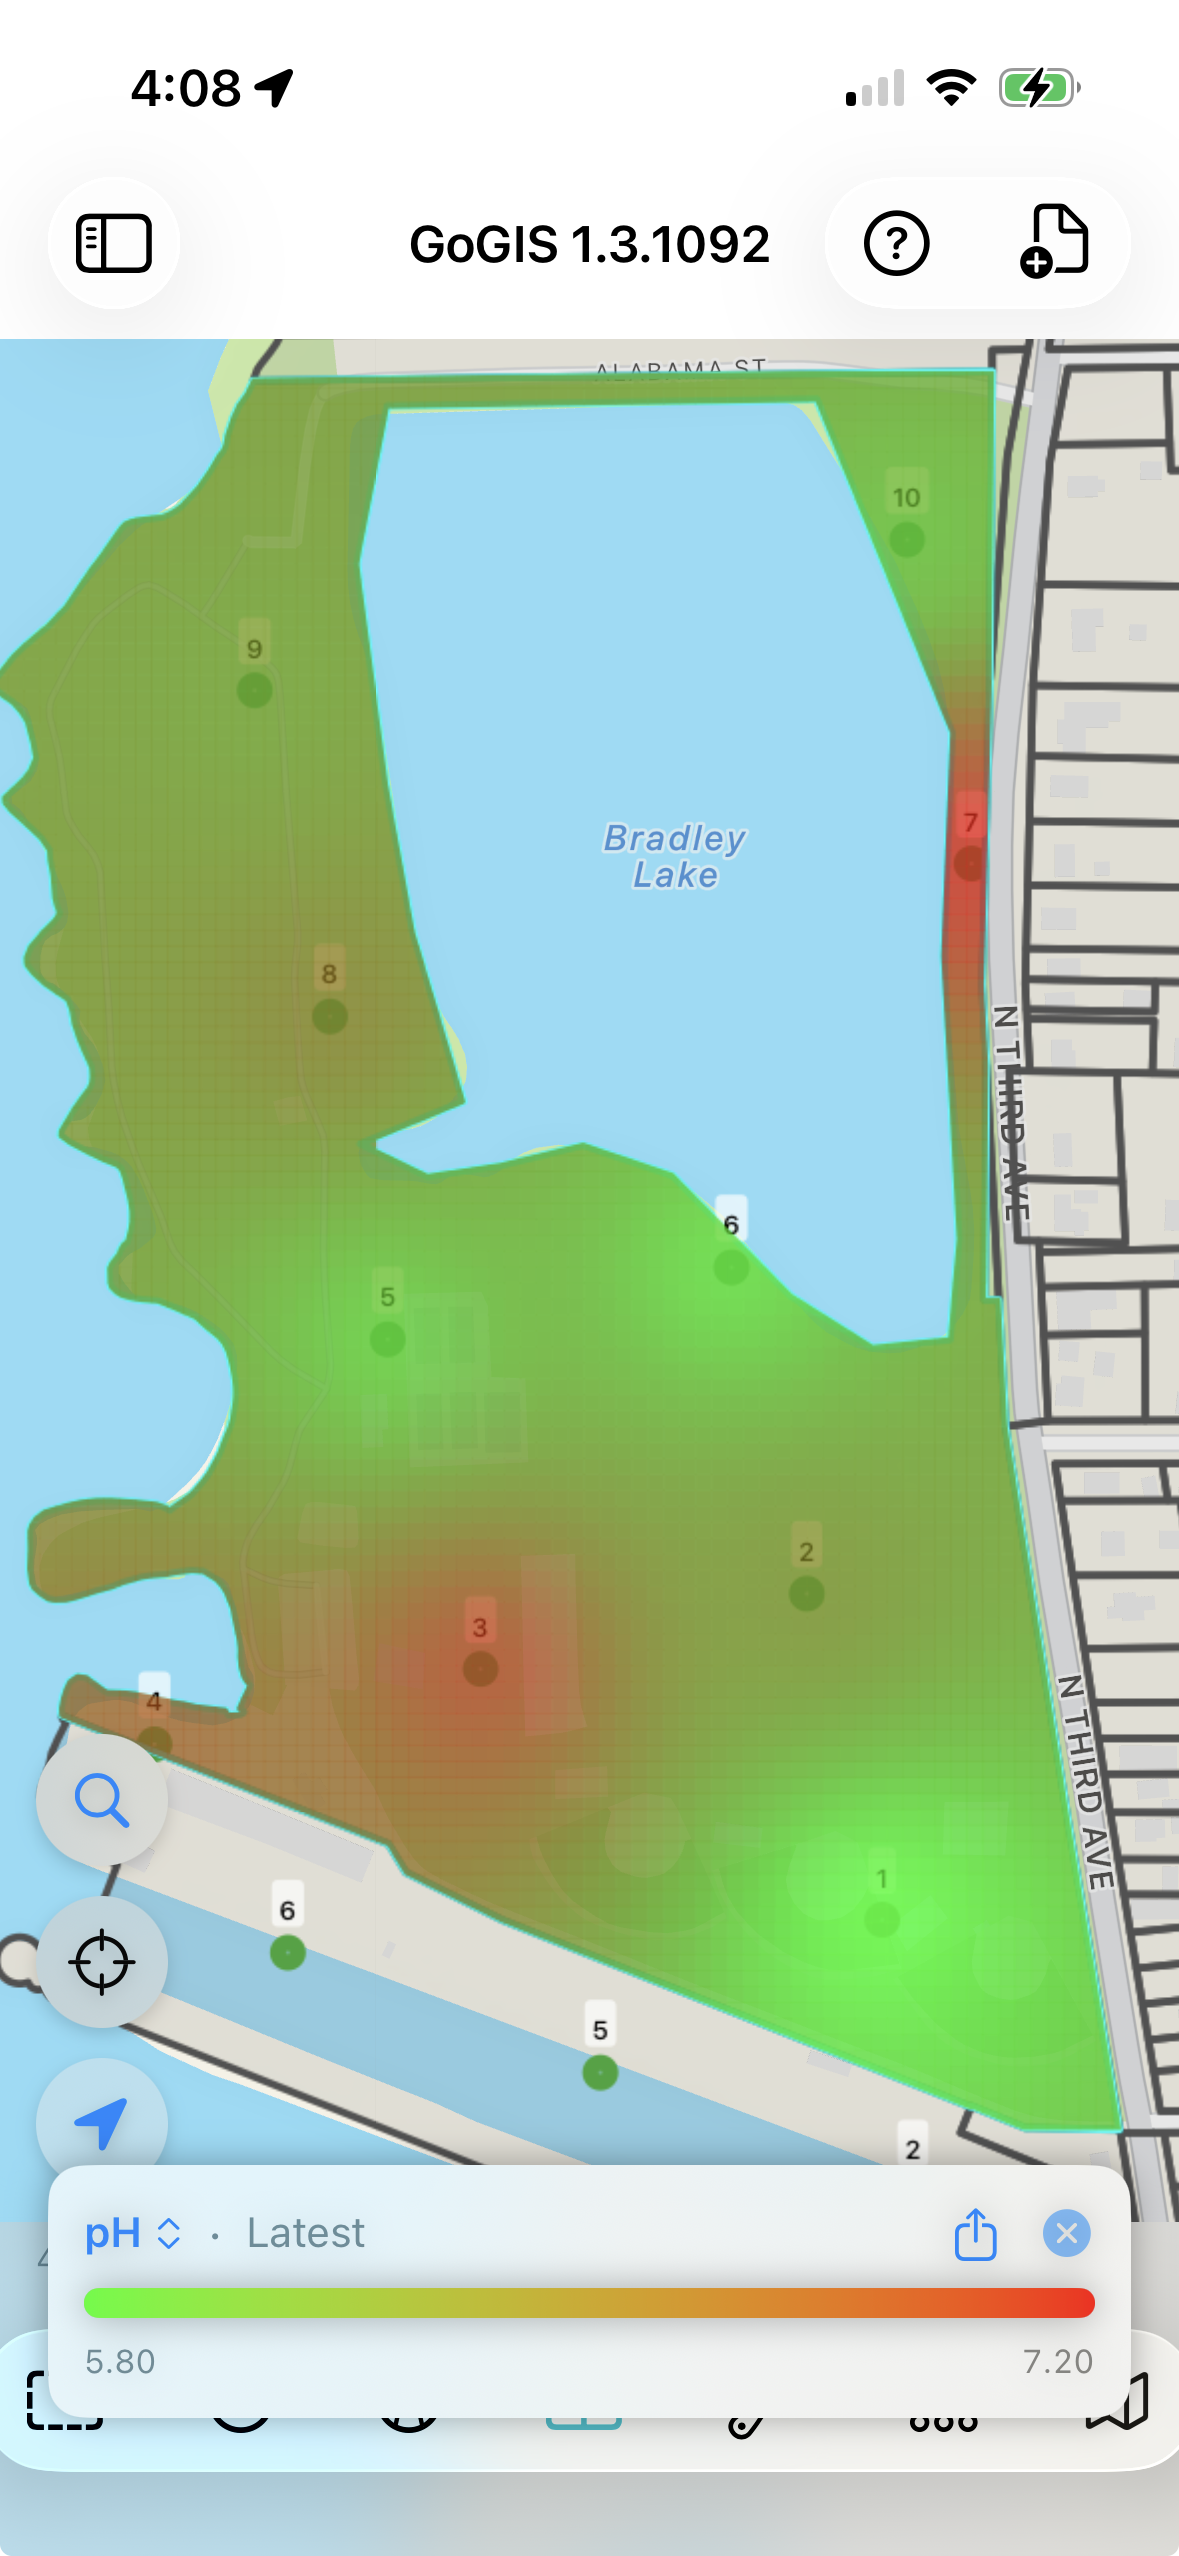
Now turn those numbers into a picture. Pick any result — pH, phosphorus, potassium, organic matter — and GoGIS interpolates a smooth color heat map clipped to your field boundary, right over the satellite image. Switch between chemicals from the legend, choose a smooth gradient or blocky management zones, and compare fields on one shared color scale. The same tool maps any point data with values — like yield, soil EC, or elevation.
11. Built-in Quality Control
Every sample point automatically records metadata you'd otherwise have to track manually:
- Parent ID — links each sample point back to the field polygon it belongs to
- Collection coordinates — records where you actually stood when you collected, not just where the grid point is
- Distance offset — shows how far you were from the target point, giving your agronomist or lab a quick quality-control check
Why distance matters: If a sample was collected 50 meters from the target point, that's worth knowing. Maybe there was a waterway in the way, maybe the GPS was drifting, maybe someone grabbed the wrong point. The distance field makes it easy to flag and review outliers.
12. Export and Share
When you're done, export the completed layer as a shapefile, GeoJSON, CSV, or KML — complete with all your attribute data, coordinates, sample numbers, and photos bundled in a ZIP. Related-form entries export alongside the layer, each carrying its sample number so repeat visits stay tied to the right point. Send it to your agronomist, upload it to your farm management platform, or open it in QGIS or ArcGIS for further analysis.
Export Sampling Reports and Data
Raw shapefiles are great for the GIS desk, but the person paying for the work usually wants something they can actually read. From the Sampling Status panel you can export several field layers at once into a single ZIP — and each one comes with a ready-to-share PDF report alongside the data.
The report opens on a satellite map of the field with every sample point colored by status — red for To Do and green for Done — over the field boundary. Then comes a fast-scan grid of every point with its collection time, coordinates, and your form values, followed by detail pages with photo thumbnails. There's also a flat CSV of the collected data, so the numbers drop straight into a spreadsheet. Pick the layers, choose a format, and you've turned a season of fieldwork into a client-ready package in one step.
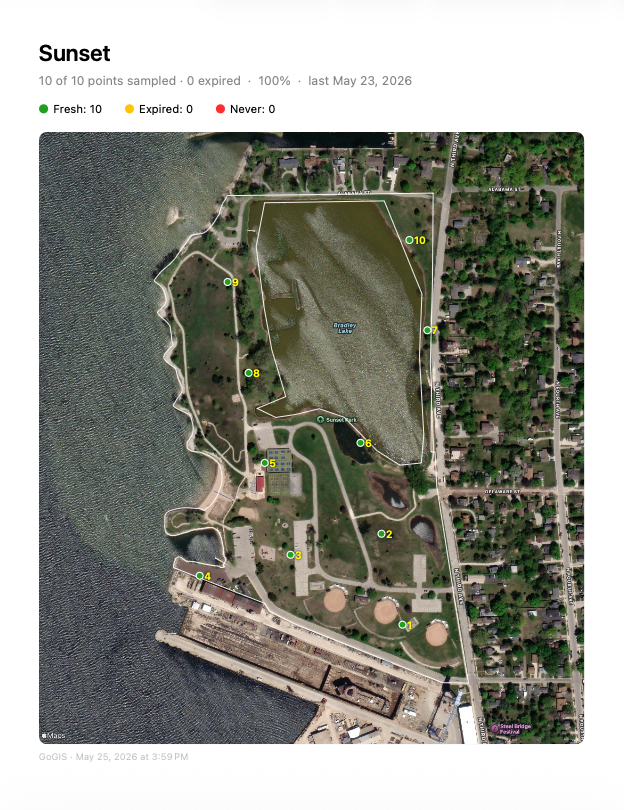
Once lab results are in, the report grows with them: a color heat-map page for every chemical joins the overview map and point detail pages, so the deliverable shows not just where you sampled but what the field actually measured.
See a real one: Download a sample soil report (PDF, 1.1 MB) generated entirely in GoGIS — overview map, per-chemical heat maps, and point detail pages.
Any Point Layer Can Become a Sampling Layer
Not every point comes from the grid tool, and two things have to hold for one to behave like a sample: it has to know which field polygon it belongs to, and which collection it is part of. The grid stamps both when it lays the points out. A point that arrives another way has to acquire them — either one at a time as you work, or a whole layer at once.
Digitize a point and it is adopted
You are standing in a field that has already been gridded and you want a core somewhere the grid did not put one — a wet spot, a rise, a place the agronomist asked about. Drop a new point on the sampling layer and GoGIS works out where it belongs: it looks at which field polygon the point falls inside, and adopts it into that field's open collection, giving it the next sample number in sequence. It appears on the status dashboard, in the Fields view, on bag labels, in routes, and in the report, exactly as if the grid had placed it.
If the point lands where two gridded fields overlap, the field you are currently working in wins — if you have one open, you have already said what you mean. With nothing open and two collections over the same ground, GoGIS leaves the point alone rather than guessing wrong.
Bringing In Existing Sample Points Made Outside GoGIS
Plenty of sampling programs do not start in GoGIS. The points already exist somewhere else: a grid your agronomist laid out and sent as a shapefile, prior-year locations exported from farm management software, a directed-sampling plan built from yield or EC data, a CSV of coordinates from a consultant, monitoring wells or established plots that have been walked for years. You want to collect against those points, not re-invent them.
Import the file and turn on sampling for the layer, and you immediately get the red and green status colors, the collection tracking and the re-sampling workflow. What you do not get is the tie to field boundaries — the points do not know which field they sit in, so the Fields view has nothing to group them by and the report has no outline to draw. The same gap appears in a grid GoGIS made itself if the source polygon layer was later deleted.
Sampling Status › Tools › Link Field Polygons makes that tie. Choose the points layer, choose the polygon layer to attach, give the collection a name — it defaults to the polygon layer's name, and it is what shows on the Fields view and in report titles — and tap Link. GoGIS matches points to polygons by their existing parent ID where there is one, then by location for the rest, repairs the collection so outlines come back, and creates a collection if none existed.
What You Don't Need Anymore
- A separate handheld GPS unit
- Paper forms and clipboards
- Manual transcription back at the office
- A separate barcode scanner
- A spreadsheet to track which fields are due for re-sampling
- Cell service for collection — prepare reference data and supported offline basemaps before leaving coverage
Works for More Than Soil
The same grid-based sampling workflow works for any field collection task where you need to visit points inside a boundary: environmental site assessments, vegetation surveys, contamination sampling, wetland delineations. Define your boundary, generate your grid, and collect your data.
Try it in your next field season
GoGIS is a one-time purchase on Android and on iPhone and iPad. No subscription, no account required, and you choose when to export or share your data.
Get GoGIS on the App Store Get GoGIS on Google Play